The Challenge
Pharmaceutical trials generate an enormous amount of data, with thousands of samples to track, manage, and analyze. And for small research teams, the time and resources it takes to sift through that data mean extended timelines and delays in getting potentially life-saving drugs into the hands of those who need them.
Our client, a global clinical research organization (CRO), had developed a SaaS product to tackle the challenge of interpreting and utilizing what is typically messy, disorganized data — but they needed some help developing a flexible framework that supported the various use cases of their customers.
Industry
Enterprise
Business Applications (B2B)
SaaS
Healthcare
Our Expertise
Digital Product Strategy
Digital Transformation
UI/UX Design
UX Research
The Solution
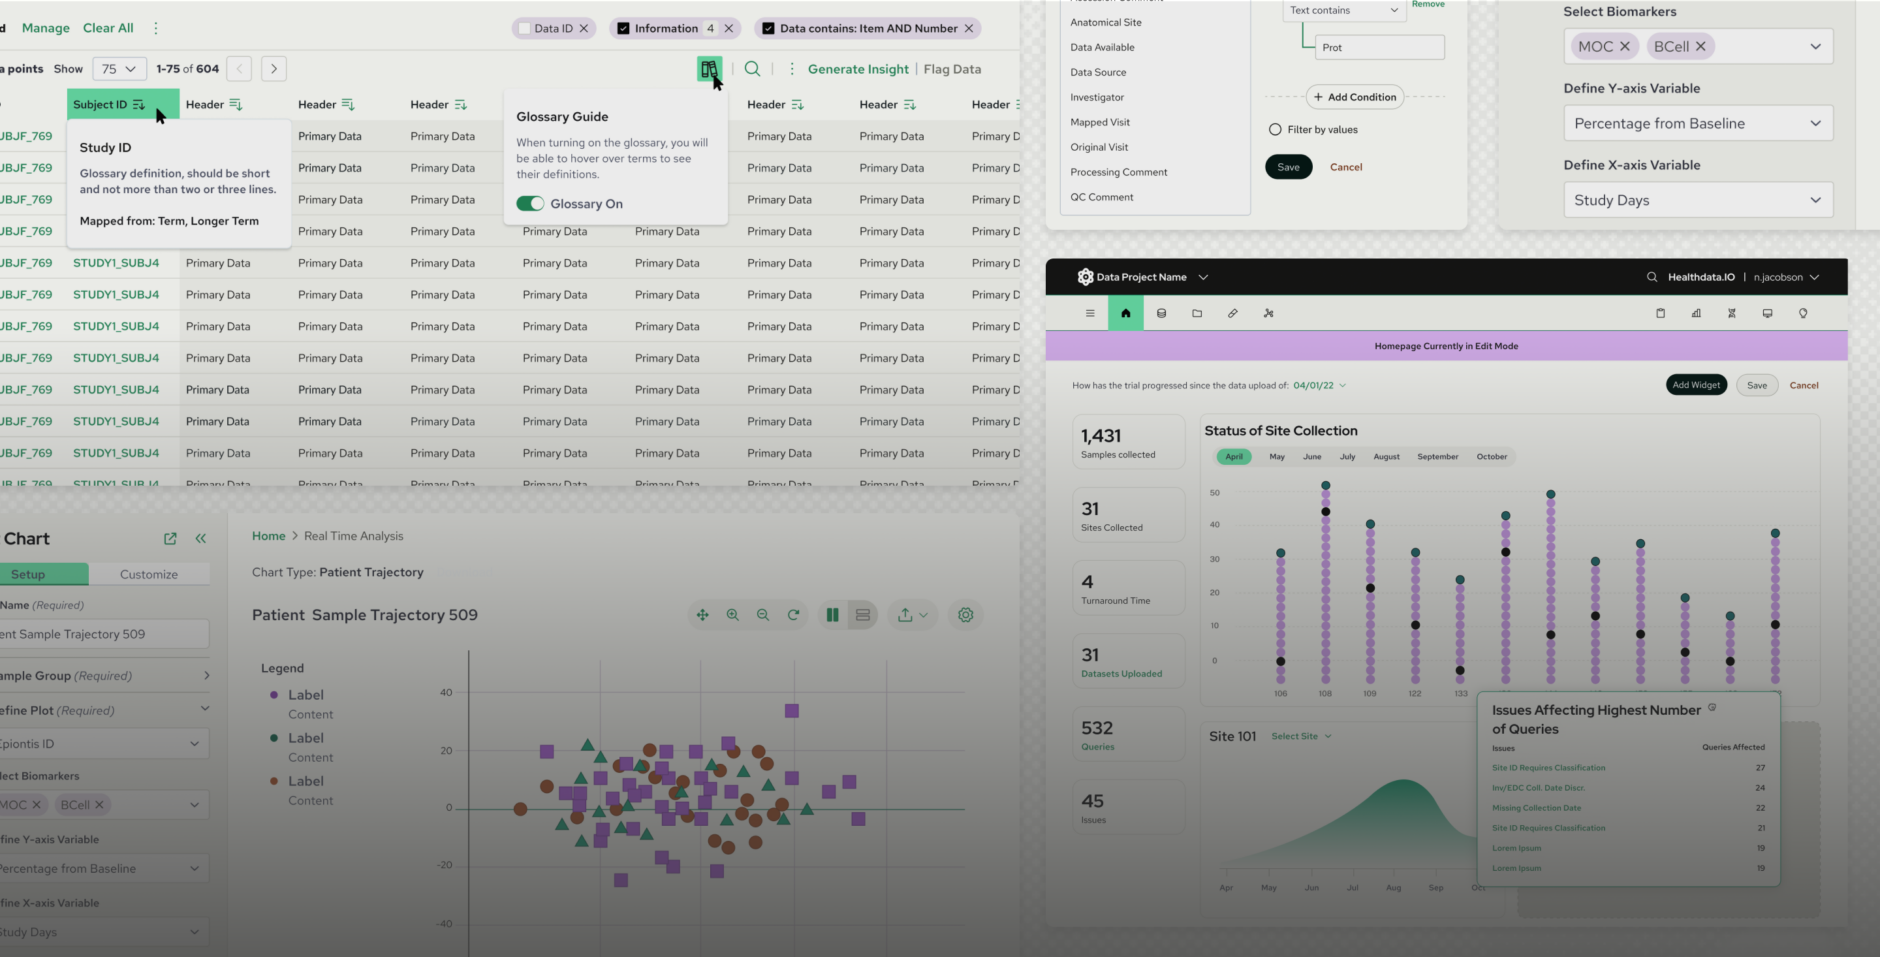
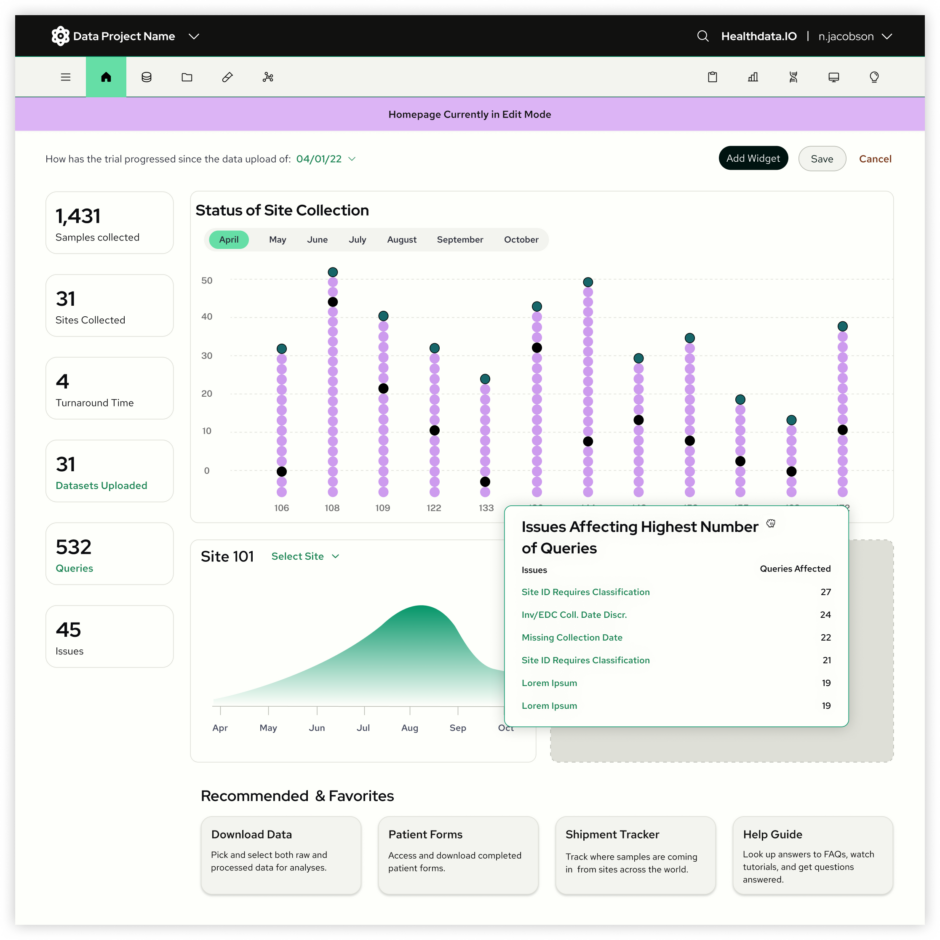
We created a robust solution that combines tabular data with complex, flexible data visualizations to connect disparate puzzle pieces and allow users to see the bigger picture. Our UX meets users where they are, whether they’re seasoned data scientists or a small team needing some help to fill a knowledge gap.
Supporting denser data
Users in highly specialized, data-heavy fields have the capacity for greater data density than the average person off the street. And research proved that this was absolutely the case with this platform.
We added user control over data density at every level of the platform — from a fully customizable landing page, advanced filtering and table views, and a flexible grid that supports both expert and novice users.

Enhance data exploration through dynamic visualizations
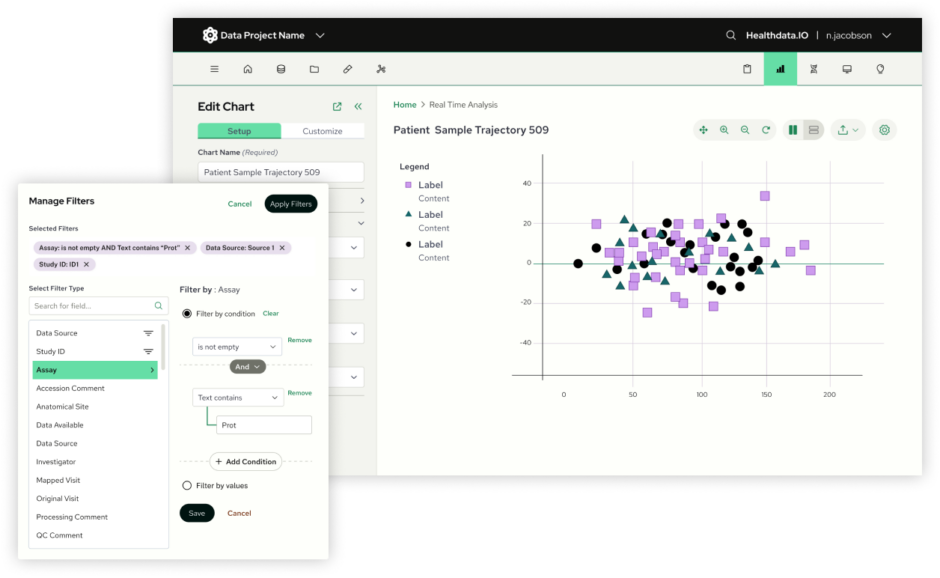
Static data visualizations are great for tracking recurring metrics, but fail to provide the flexibility that would allow for meaningful insights.
We built a new framework for exploring and comparing data in data visualizations, focusing on the need to sort, filter, switch up the data source, and switch up the chart type. Our strategy was to put the control in the hands of the users, allowing them to immediately see the impact of their choices on the data and uncover trends quickly and efficiently.
The right level of support
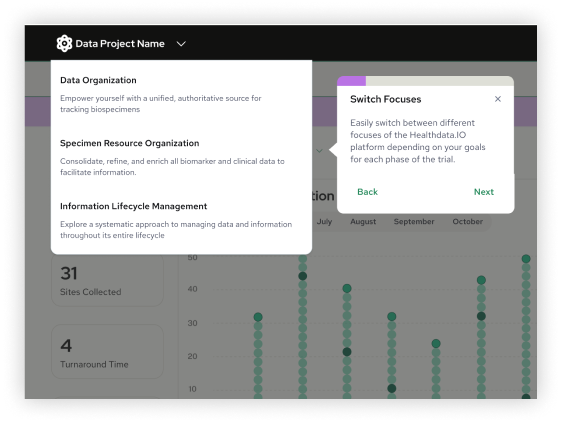
Because of the long timelines of pharmaceutical trials, users go through periods when they’re deep in the weeds of analyzing data, and periods when they’re not. This means that even “expert” users may lose some of their familiarity with the tool throughout the course of a trial.
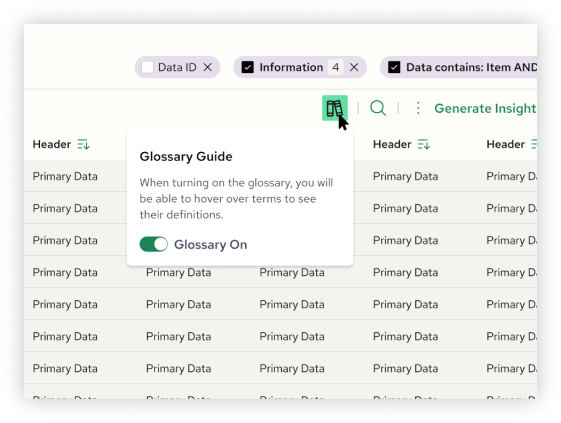
We needed to make help and guidance easily accessible to help users get back up to speed quickly. We worked alongside the client team to implement a new support platform, and created a system of tooltips and definitions embedded contextually throughout the application to help the user when they need it most.
Design Process
Discovery Research
- Ran extensive user research with end customers to understand current pain points, user workflows, and opportunities.
- Performed a heuristic evaluation of the current product, utilizing UX Scorecards to provide a baseline for measurable impact.
- Conducted a comparative analysis of competitor tools, to help pinpoint key areas of differentiation and opportunity.
Design System
- Created new moodboards and a visual foundation that extended the current branding for a modern digital product.
- Delivered a robust design system, documenting established patterns used across the current tool and usage rules.
UX/UI Design
- Mapped key workflows and processes into process flows, establishing how users will move through the newly defined framework.
- Redesigned the platform’s information architecture for an improved experience across multiple platforms and devices
- Built low-fidelity wireframes and interactive prototypes to establish the new layout and features.
- Delivered high-fidelity visual design comps that aligned the client’s brand positioning with UI and interface best practices
- Worked closely with the client’s product and engineering teams to ensure a clear and seamless handoff to development.
Results
We successfully addressed the challenges that users experienced with the v1 of the product, enhanced the overall ease of use and experience, and brought the product into alignment with best practices. Our solution measurably increased user empowerment, and made complex pharmaceutical trial data more manageable and accessible to a wider variety of clinical teams.
Key results included:
- A 18% increase in user engagement post-launch.
- A 15% increase in self-reported user confidence and independence in data analysis.
- Increased support for a broader range of users, including those who did not consider themselves data scientists.
Have a project you'd like to discuss?
We'd love to speak with you about your project and how our user experience services can help.
Contact Us