Is your team worried about the amount of investment you are (or are not) making for UX design? Better yet, ever wanted to demonstrate the business value of design for your company? You aren’t alone—the ROI of design matters.
As a recent McKinsey & Co. research demonstrates, tracking design metrics is the top way to demonstrate design value and a chief concern of design leaders. Whether you are building a consumer-facing digital product or building internal tools for your company, Fuzzy Math advises all clients who want to establish a mature UX organization to establish and track a set of design metrics. These metrics provide the continuous pulse of your users and, once aligned with business KPIs, connect design to overall business health.
Potential design metrics
There are many potential design KPIs that you can measure over time, but we’ve covered a few below and highlighted our recommendation.
Non-design
- NPS – Net Promoter Score is a useful metric because of its ubiquity and utilization in businesses. NPS is tracked over time, providing an insight into how satisfied your customers are with your brand or business. It can also easily be compared to competitors, and it allows for follow-up questions when there are areas of concern. However, NPS tracks satisfaction at the company (or more likely brand) level and unless your brand is synonymous with your product it isn’t a true measure of satisfaction with a specific product and its design.
- Customer satisfaction – A generic customer satisfaction metric is similar to NPS but without the strict formulation. It also means more flexibility in the questions you ask and the follow-ups. The downside is that you can’t compare to your competitors like you can with NPS.
Design-centric
- User satisfaction (Our recommendation) – Much like customer satisfaction above, user satisfaction is tied much more closely to the usage of your application. However, your customer isn’t always the same as your end user, and focusing on user satisfaction allows you to track components such as usability, trust, and credibility as viewed by someone that uses your application on a regular basis. Fuzzy Math recommends using something like SUPR-Q for assessing the usability and satisfaction of an application. SUPR-Q provides a standard set of questions that roll up to a single satisfaction score. (Note: There is no charge for SUPR-Q, but there is a charge to view the scores of competitors). You can also take the standard SUPR-Q questions and modify to suit your own needs.
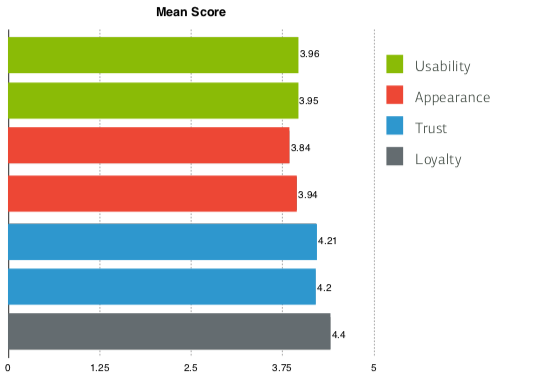
An example of a SUPR-Q output - Traditional analytics – Traditional web analytics, such as you’d find in Google Analytics, are helpful for monitoring changes over time (visits, session length) but are very difficult to utilize within a “signed-in experience”. Further, they do not provide any sense of how the user feels about the experience, only what the data says. While helpful in tandem with another form of metrics, traditional web analytics on their own do not give a true sense of how your product is performing.
- Quantitative design research – Certain techniques such as heat maps and time-to-task tracking provide quantitative data to gauge the experience of your users. They allow for in-the-moment feedback and illustrate clear ways to improve your design. While valuable for incremental checks and generating design improvements, they are not trackable over time as you will inevitably want to test different features or use cases over a product life cycle.
Align with your business
Design metrics are only truly valuable when they are directly compared to key business goals, drivers, and KPIs. So how do you keep your design and business metrics in alignment?
- Review existing business drivers and KPIs – A team of stakeholders, including representation for executive leadership, should select which existing business drivers and KPIs directly relate to customer satisfaction. These can be as high-level as revenue or as low-level as unique users, user retention rates, or conversion goals. You should have one primary KPI for comparison with your design metric but nothing limits you to tracking secondary KPIs as well.
- Perform longitudinal research resulting in quantitative data points – We believe that design metrics need to be tracked over a long period of time in a longitudinal study. This means asking standard (the same) questions at regular intervals so that you can compare the data from one period of time to the next.
- Be realistic about what you can track – There is no sense in setting all of this up if you can’t realistically track it. While there are some items you can start immediately (see implementation below), don’t start tracking your set of metrics until you are sure you can run the tracking research at regular intervals and in a consistent fashion.
- Track UX changes over time – Tracking design metrics at regular intervals creates a longer view of the shifts over time. Record and communicate what has changed in the user experience between each interval so that you understand how they are impacting the user satisfaction over time.
- Blend general and specified questions – Tracking “metrics” requires tracking data that generates a number which can be compared over time in a statistically valid way. This will establish a general trend in user satisfaction. But you can add additional, more specific questions that may or may not be comparable over time. These could be about significant changes you made, a new feature, or the aesthetics of the design. Be careful not to overload your users with too many questions—limit your questions to less than five in order to ensure a high completion rate for the survey.
Implementation
There are a number of clear steps to execute this quickly, correctly, and in a repeatable format.
- Create a customer panel – If you don’t have a formal list of users that you can reach out to for UX research, start tomorrow. It can be as easy as a spreadsheet or robust as a CRM. But start asking now (via email, site intercept, etc.) if users would be interested in participating in research. Over time, establish a more formal voice of the customer (VOC) program. Provide incentives to increase response rate if needed and follow up after research with any information on how their feedback improved the designs. Users want to be heard and view your organization as more trustworthy when you ask for their assistance.
- Surveys – Build your own surveys so that you can set the questions up yourself and analyze the data properly over time. Invest in survey software such as SurveyMonkey or Qualtrics so that you aren’t scrambling for a reliable platform each time.
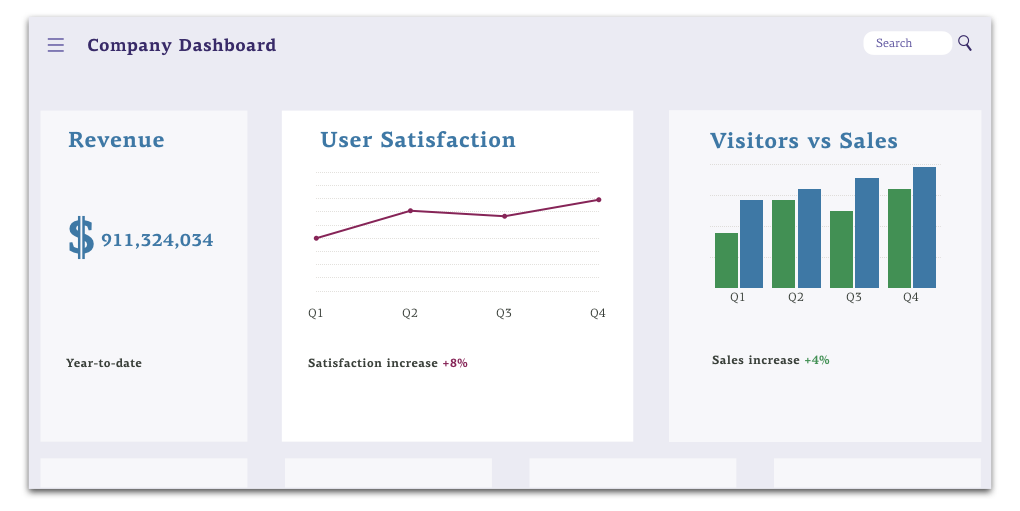
- Connect to business KPIs & share – Once you know the business KPIs and have established a user satisfaction metric, they should be shared together with your entire company. Place them alongside (literally next to) business KPIs (for example, in a dashboard) so that there is a clear indication of how user satisfaction is changing alongside business metrics.
- Set your baseline – Run your first survey as soon as you are ready and establish it as your baseline. All improvements made from that point forward will now be trackable against that baseline. Then set goals for user satisfaction improvements over time and compare to the actual results.
Moving forward…
Blend quantitative user satisfaction metrics with qualitative design research.
While we are advocating to measure user satisfaction as your core gauge of design ROI, qualitative design research is still invaluable in the UX design process. While you are running the longitudinal user satisfaction research, you should regularly perform traditional design research (cognitive walkthroughs, usability testing, UX benchmarking, etc.). Use smaller sample sizes on early-stage designs, prototypes, and the working application. This will provide much more specific feedback that will provide clear design improvements.
Both methods (survey for metrics and design research for improvement) should be run at regular intervals and in-sync with each other. As you make improvements based on the qualitative design research, you can measure the impact on the overall user satisfaction in the quantitative surveys. This now enables your design team, product group, technology team, and/or entire company to track the impact of their work over time.
Want more on the ROI of UX Design? Catch Mark Baldino on a recent episode of The UI Breakfast Podcast!