
UX research can be done in a number of ways, often in combination with different methods. One of the most common methods we use are surveys. Surveys are great for projects looking to gather large amounts of data in a small amount of time. In particular, surveys provide UX teams with lots of quantitative data, which is data that helps prove the value of something through numbers.
Although we don’t recommend using surveys as a replacement for one-on-one UX research, like contextual inquiry or interviews, sending out surveys and using them in conjunction with other research is a nice supplement to your UX project. Additionally, in times of relying on remote work and research, like we are now during the COVID-19 pandemic, using surveys is a great addition to your research tool belt because there is no in-person requirement. With that in mind, here are our best practices around conducting surveys for UX research.
Crafting a survey
Developing a survey might seem as easy as putting a list of questions together, but in order to get the best data you can, there are steps you can take to make sure you are asking the right questions to the right people in the best way possible.
To start, you and your team of other UX researchers need to have a clear understanding of your survey goals. Do you want to understand what factors play into users’ decisions to choose your client’s product? Are you interested in learning more about who the product’s potential new users could be? Having these clear, overarching questions in mind will help you ask more specific questions to survey takers and get the data you need to move forward.
We recommend drafting your questions in a shared document where multiple people on your team can contribute. This way, you can all build from one another, get feedback in real-time, and see the bigger picture by having everything in one place.
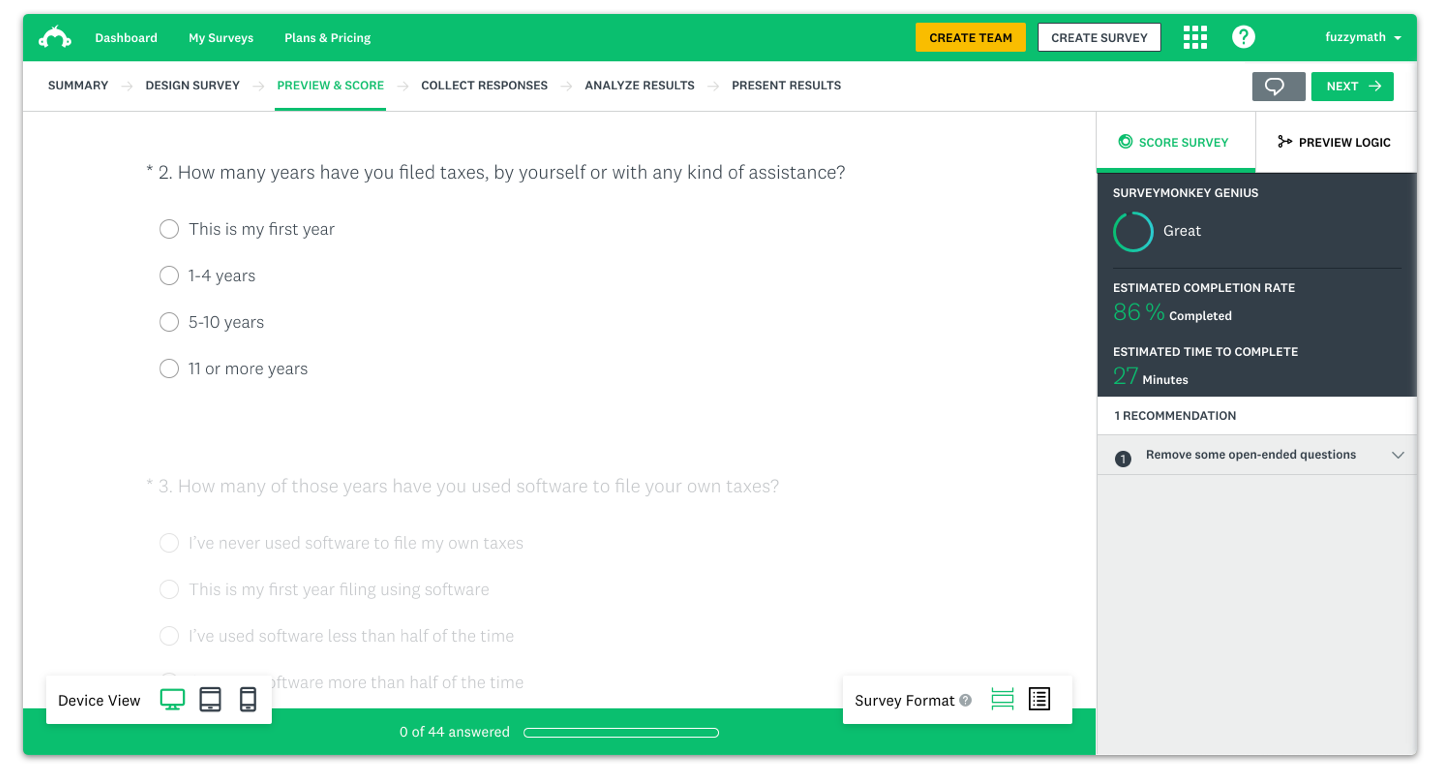
Include a mix of open-ended and multiple-choice questions, and consider randomizing, flipping, and asking the same question from multiple perspectives. Doing this makes sure users are actually reading the questions and not just skimming through. Keep in mind that it takes a lot more effort on your end to go through open-ended questions and you will likely not be able to follow up with respondents to gain clarity on their answers. So, be as strategic as possible about these questions and even consider making open-ended questions optional. If you get stuck on how to craft your survey questions or aren’t sure what to ask, Surveymonkey has a great set of resources including prebuilt questions you can adapt to meet your survey’s needs.
Once you have your questions listed out, make sure to go over them and check you’ve added an “other” option with optional description for certain questions so users can add an answer if none of the ones provided applies. Also, check that the other potential answers for those multiple-choice questions, checkbox questions, and matrix-type questions are clear and cannot be interpreted in multiple ways. This can be tricky to do if you have been completely immersed in the project for some time, so try testing out your survey with others at your company to see how the survey reads to them. This is also your chance to test out logic branches if you’ve incorporated them into your survey. That way, you can ensure that if specific answers are intended to take users to different questions, the flow is correct.
Once the questions are in a good place, share the spreadsheet with your client, but make sure to only allow them enough access to comment. Otherwise, you will not be able to see what they change! From there, make any necessary updates to your questions and see how long it takes to get through. You should try to shoot to have your survey take around 10-15 minutes to complete.
Recruiting for a UX research survey
After putting your survey together, you will have to find a way to recruit participants to actually take it. There are a number of ways to do this including sending out the survey to a newsletter (or any other) mailing list, setting up a website intercept, or using a third-party recruiting tool.
Using a mailing list is likely the most convenient option because you already have a list of contacts that regularly engage with your client’s company. However, that can also have a negative impact on your data. By using a mailing list, your data may be skewed because the group is already familiar with the tool or product and has already cared enough to sign up for their mailing list. Knowing this, you have to consider whether or not this audience alone will supply you with the insights you want to gain for your research.
Going the website intercept route is still a convenient option, but it casts a wider net than the email audience because users visiting your website may not necessarily be on the mailing list. However, your audience will still be segmented because users have to be familiar with your website in order to take the survey. Additionally, this would require access to the backend of the website in order to implement so that it is both effective and not burdensome for users to complete. This will take additional time and effort to develop but might be the better option for your project.
Lastly, if you know that you are looking to reach potential new users or others not familiar with your product, using a third party recruiting tool is your best option. This route would allow you to cast the widest net and reach an audience that is completely new. This is a great option for you if you don’t have an audience yet or even if you’re just looking to expand your audience. Depending on your tool of choice, you may even be able to set up a pre-screen in order to get a specific audience or as granular as you need for your project. We like Respondent just for this reason — they vet and validate their participants. Unfortunately, the company recently discontinued their survey services and limited their study size to 50 participants, but if you’re running a small survey with a highly specialized group of people and looking for participants, this could still be a great option!
The only downside for going with a third-party recruiting tool is that there is no way to do it for free, but, depending on the scope of your project, it could be a worthwhile investment.
Reporting survey findings
You’ve crafted your survey, sent it our to participants, and analyzed their responses. Now, you have to find a way to report back to your client and the rest of the team on the project what new findings came about from the survey. It’s likely that you will present all of your research findings to your clients during a meeting, so focusing on ways to best represent your data that can be processed over the course of an hour or so is essential. Here are a few things to keep in mind when putting your findings together.
Make it digestible
Your presentation should cover only the high-level findings from the survey, including things like questions a majority of respondents agreed or disagreed on, responses that may have surprised you, and answers to key questions that get to the root of your survey’s goal. Avoid getting too granular with your presentation. Most clients are more interested in seeing how the overall research will influence future project decisions. However, there are some cases where clients actually do want to see more detailed data from your research. For those instances, we recommend adding an appendix to the presentation with those granular results. That way you can pull them up in the moment or have them easily accessible for clients to look through in their own time.
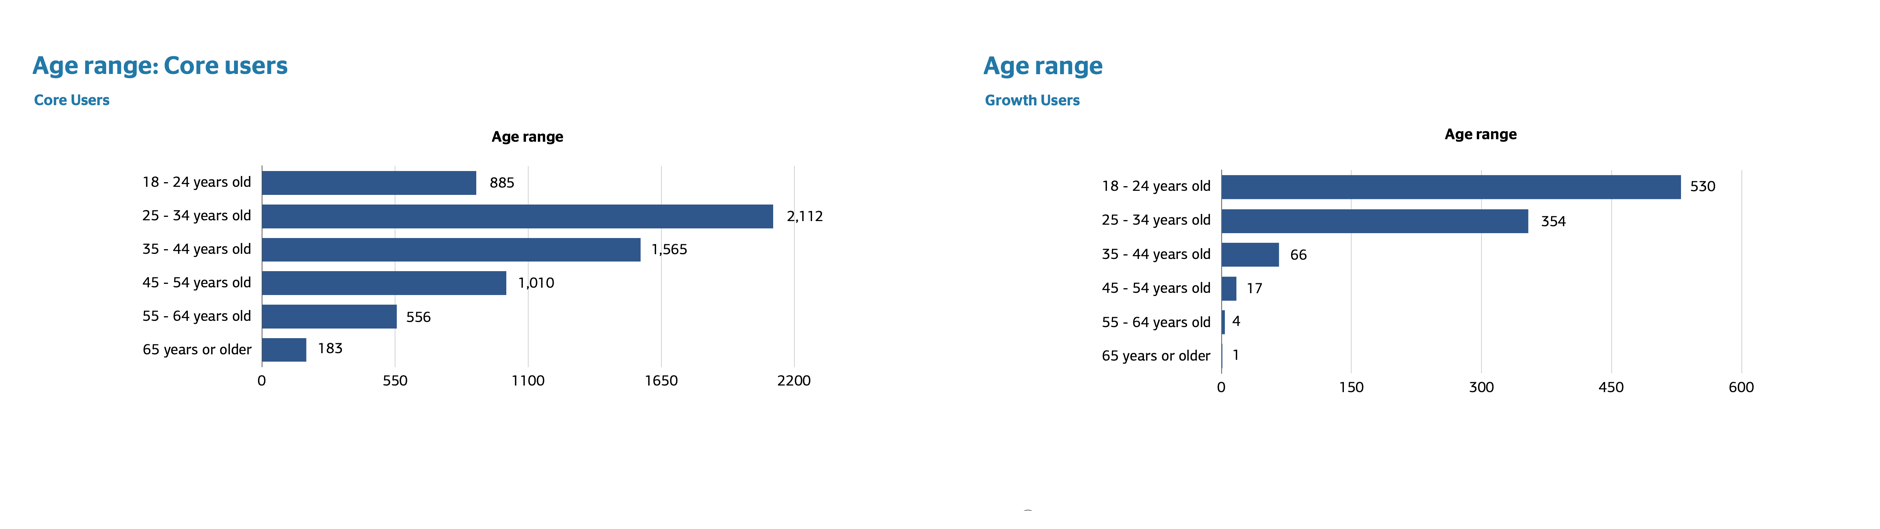
Whenever possible use graphs and charts
Following the previous point, it is best to use visual representations of data whenever possible. It not only makes it easier for clients to see these findings clearly during your presentation, but it will make it easier for them to refer back to as the project goes on, if needed. Most survey services automatically create charts and graphs from survey respondent answers to multiple-choice questions, which can then be exported and compiled into a presentation slide. Just remember to clearly color code and label each graph and chart so everyone understands what they’re looking at!
Pull relevant quotes from open-ended questions
Although surveys are mainly a tool to gather quantitative data, if you choose to include open-ended questions in your survey, the best way to highlight responses is to pull a few strong quotes. These quotes can help contextualize the multiple-choice answers and give your client a look into the mind of the user. It’s nice to remind everyone that users are real people and not just numbers.
Need some help with getting your UX research off the ground? Reach out to us to see how Fuzzy Math can help identify and understand your project’s users and needs.